不论什么语言的开发,都会涉及到下面的几个问题,代码的运行时间,性能出现的瓶颈,内存的占用情况,是否有内存的泄露等等,同样Python也不例外,本文介绍了几个优秀的Python工具,可以实现如上所述问题的检测机制,通过动态运行跟踪代码的执行情况,从而发现问题点。
While it’s not always the case that every Python program you write will require a rigorous performance analysis, it is reassuring to know that there are a wide variety of tools in Python’s ecosystem that one can turn to when the time arises.
Analyzing a program’s performance boils down to answering 4 basic questions:
- How fast is it running?
- Where are the speed bottlenecks?
- How much memory is it using?
- Where is memory leaking?
Below, we’ll dive into the details of answering these questions using some awesome tools.
Coarse grain timing with time(代码执行时间)
Let’s begin by using a quick and dirty method of timing our code: the good old unix utilitytime.
$ time python yourprogram.py

real    0m1.028s
user    0m0.001s
sys     0m0.003s
The meaning between the three output measurements are detailed in this stackoverflow article, but in short
- real - refers to the actual elasped time
- user - refers to the amount of cpu time spent outside of kernel
- sys - refers to the amount of cpu time spent inside kernel specific functions
You can get a sense of how many cpu cycles your program used up regardless of other programs running on the system by adding together the sys and user times.
If the sum of sys and user times is much less than real time, then you can guess that most your program’s performance issues are most likely related to IO waits.
Fine grain timing with a timing context manager
Our next technique involves direct instrumentation of the code to get access to finer grain timing information. Here’s a small snippet I’ve found invaluable for making ad-hoc timing measurements:
timer.py
1 2 3 4 5 6 7 8 9 10 11 12 13 14 15 16 | import time class Timer(object): def __init__(self, verbose=False): self.verbose = verbose def __enter__(self): self.start = time.time() return self def __exit__(self, *args): self.end = time.time() self.secs = self.end - self.start self.msecs = self.secs * 1000 # millisecs if self.verbose: print 'elapsed time: %f ms' % self.msecs |
import time

class Timer(object):
    def __init__(self, verbose=False):
        self.verbose = verbose

    def __enter__(self):
        self.start = time.time()
        return self

    def __exit__(self, *args):
        self.end = time.time()
        self.secs = self.end - self.start
        self.msecs = self.secs * 1000  # millisecs
        if self.verbose:
print 'elapsed time: %f ms' % self.msecsIn order to use it, wrap blocks of code that you want to time with Python’s with keyword and this Timer context manager. It will take care of starting the timer when your code block begins execution and stopping the timer when your code block ends.
Here’s an example use of the snippet:
1 2 3 4 5 6 7 8 9 10 11 | from timer import Timer from redis import Redis rdb = Redis() with Timer() as t: rdb.lpush("foo", "bar") print "=> elasped lpush: %s s" % t.secs with Timer as t: rdb.lpop("foo") print "=> elasped lpop: %s s" % t.secs |
from timer import Timer
from redis import Redis
rdb = Redis()

with Timer() as t:
    rdb.lpush("foo", "bar")
print "=> elasped lpush: %s s" % t.secs

with Timer as t:
    rdb.lpop("foo")
print "=> elasped lpop: %s s" % t.secsI’ll often log the outputs of these timers to a file in order to see how my program’s performance evolves over time.
Line-by-line timing and execution frequency with a profiler(代码行运行时间分析)
Robert Kern has a nice project called line_profiler which I often use to see how fast and how often each line of code is running in my scripts.
To use it, you’ll need to install the python package via pip:
$ pip install line_profiler
Once installed you’ll have access to a new module called “line_profiler” as well as an executable script “kernprof.py”.
To use this tool, first modify your source code by decorating the function you want to measure with the @profile decorator. Don’t worry, you don’t have to import anyting in order to use this decorator. The kernprof.py script automatically injects it into your script’s runtime during execution.
primes.py
1 2 3 4 5 6 7 8 9 10 11 12 13 14 15 16 17 18 19 20 21 22 | @profile def primes(n): if n==2: return [2] elif n<2: return [] s=range(3,n+1,2) mroot = n ** 0.5 half=(n+1)/2-1 i=0 m=3 while m <= mroot: if s[i]: j=(m*m-3)/2 s[j]=0 while j<half: s[j]=0 j+=m i=i+1 m=2*i+3 return [2]+[x for x in s if x] primes(100) |
@profile
def primes(n):
    if n==2:
        return [2]
    elif n<2:
        return []
    s=range(3,n+1,2)
    mroot = n ** 0.5
    half=(n+1)/2-1
    i=0
    m=3
    while m <= mroot:
        if s[i]:
            j=(m*m-3)/2
            s[j]=0
            while j<half:
                s[j]=0
                j+=m
        i=i+1
        m=2*i+3
    return [2]+[x for x in s if x]
primes(100)Once you’ve gotten your code setup with the @profile decorator, use kernprof.py to run your script.
$ kernprof.py -l -v fib.py
The -l option tells kernprof to inject the @profile decorator into your script’s builtins, and -v tells kernprof to display timing information once you’re script finishes. Here’s one the output should look like for the above script:
Wrote profile results to primes.py.lprof
Timer unit: 1e-06 s

File: primes.py
Function: primes at line 2
Total time: 0.00019 s

Line #      Hits         Time  Per Hit   % Time  Line Contents
==============================================================
     2                                           @profile
     3                                           def primes(n):
     4         1            2      2.0      1.1      if n==2:
     5                                                   return [2]
     6         1            1      1.0      0.5      elif n<2:
     7                                                   return []
     8         1            4      4.0      2.1      s=range(3,n+1,2)
     9         1           10     10.0      5.3      mroot = n ** 0.5
    10         1            2      2.0      1.1      half=(n+1)/2-1
    11         1            1      1.0      0.5      i=0
    12         1            1      1.0      0.5      m=3
    13         5            7      1.4      3.7      while m <= mroot:
    14         4            4      1.0      2.1          if s[i]:
    15         3            4      1.3      2.1              j=(m*m-3)/2
    16         3            4      1.3      2.1              s[j]=0
    17        31           31      1.0     16.3              while j<half:
    18        28           28      1.0     14.7                  s[j]=0
    19        28           29      1.0     15.3                  j+=m
    20         4            4      1.0      2.1          i=i+1
    21         4            4      1.0      2.1          m=2*i+3
    22        50           54      1.1     28.4      return [2]+[x for x in s if x]
Look for lines with a high amount of hits or a high time interval. These are the areas where optimizations can yield the greatest improvements.
How much memory does it use?(内存占用)
Now that we have a good grasp on timing our code, let’s move on to figuring out how much memory our programs are using. Fortunately for us, Fabian Pedregosa has implemented a nicememory profiler modeled after Robert Kern’s line_profiler.
First install it via pip:
$ pip install -U memory_profiler
$ pip install psutil
(Installing the psutil package here is recommended because it greatly improves the performance of the memory_profiler).
Like line_profiler, memory_profiler requires that you decorate your function of interest with an@profile decorator like so:
1 2 3 4 | @profile def primes(n): ... ... |
@profile
def primes(n):
    ...
...To see how much memory your function uses run the following:
$ python -m memory_profiler primes.py
You should see output that looks like this once your program exits:
Filename: primes.py

Line #    Mem usage  Increment   Line Contents
==============================================
     2                           @profile
     3    7.9219 MB  0.0000 MB   def primes(n):
     4    7.9219 MB  0.0000 MB       if n==2:
     5                                   return [2]
     6    7.9219 MB  0.0000 MB       elif n<2:
     7                                   return []
     8    7.9219 MB  0.0000 MB       s=range(3,n+1,2)
     9    7.9258 MB  0.0039 MB       mroot = n ** 0.5
    10    7.9258 MB  0.0000 MB       half=(n+1)/2-1
    11    7.9258 MB  0.0000 MB       i=0
    12    7.9258 MB  0.0000 MB       m=3
    13    7.9297 MB  0.0039 MB       while m <= mroot:
    14    7.9297 MB  0.0000 MB           if s[i]:
    15    7.9297 MB  0.0000 MB               j=(m*m-3)/2
    16    7.9258 MB -0.0039 MB               s[j]=0
    17    7.9297 MB  0.0039 MB               while j<half:
    18    7.9297 MB  0.0000 MB                   s[j]=0
    19    7.9297 MB  0.0000 MB                   j+=m
    20    7.9297 MB  0.0000 MB           i=i+1
    21    7.9297 MB  0.0000 MB           m=2*i+3
    22    7.9297 MB  0.0000 MB       return [2]+[x for x in s if x]
Where’s the memory leak?(内存泄露)
The cPython interpreter uses reference counting as it’s main method of keeping track of memory. This means that every object contains a counter, which is incremented when a reference to the object is stored somewhere, and decremented when a reference to it is deleted. When the counter reaches zero, the cPython interpreter knows that the object is no longer in use so it deletes the object and deallocates the occupied memory.
A memory leak can often occur in your program if references to objects are held even though the object is no longer in use.
The quickest way to find these “memory leaks” is to use an awesome tool called objgraphwritten by Marius Gedminas. This tool allows you to see the number of objects in memory and also locate all the different places in your code that hold references to these objects.
To get started, first install objgraph:
pip install objgraph
Once you have this tool installed, insert into your code a statement to invoke the debugger:
1 | import pdb; pdb.set_trace() |
import pdb; pdb.set_trace()
Which objects are the most common?
At run time, you can inspect the top 20 most prevalent objects in your program by running:
(pdb) import objgraph
(pdb) objgraph.show_most_common_types()

MyBigFatObject             20000
tuple                      16938
function                   4310
dict                       2790
wrapper_descriptor         1181
builtin_function_or_method 934
weakref                    764
list                       634
method_descriptor          507
getset_descriptor          451
type                       439
Which objects have been added or deleted?
We can also see which objects have been added or deleted between two points in time:
(pdb) import objgraph
(pdb) objgraph.show_growth()
.
.
.
(pdb) objgraph.show_growth()   # this only shows objects that has been added or deleted since last show_growth() call

traceback                4        +2
KeyboardInterrupt        1        +1
frame                   24        +1
list                   667        +1
tuple                16969        +1
What is referencing this leaky object?(资源引用计数)
Continuing down this route, we can also see where references to any given object is being held. Let’s take as an example the simple program below:
1 2 3 | x = [1] y = [x, [x], {"a":x}] import pdb; pdb.set_trace() |
x = [1]
y = [x, [x], {"a":x}]
import pdb; pdb.set_trace()To see what is holding a reference to the variable x, run the objgraph.show_backref()function:
(pdb) import objgraph
(pdb) objgraph.show_backref([x], filename="/tmp/backrefs.png")
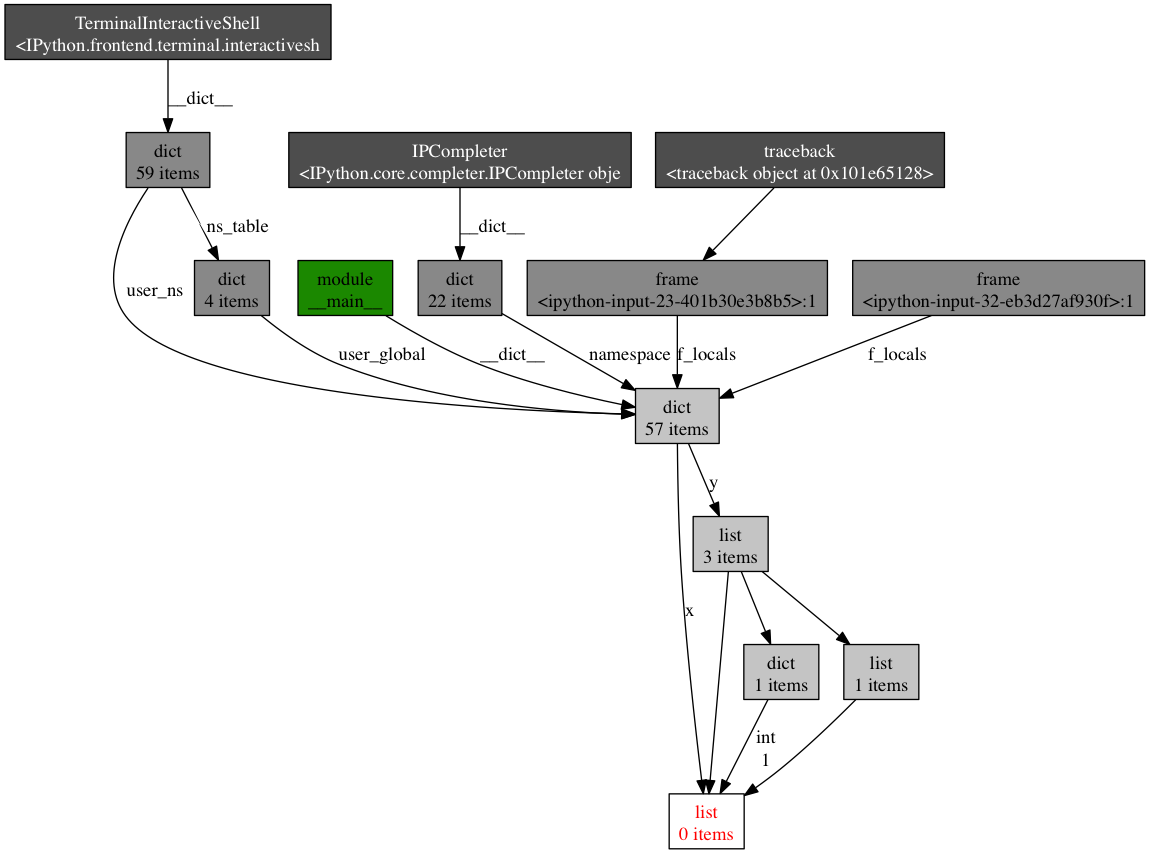
The output of that command should be a PNG image stored at /tmp/backrefs.png and it should look something like this:

The box at the bottom with red lettering is our object of interest. We can see that it’s referenced by the symbol x once and by the list y three times. If x is the object causing a memory leak, we can use this method to see why it’s not automatically being deallocated by tracking down all of its references.
So to review, objgraph allows us to:
- show the top N objects occupying our python program’s memory
- show what objects have been deleted or added over a period of time
- show all references to a given object in our script
Effort vs precision
In this post, I’ve shown you how to use several tools to analyze a python program’s performance. Armed with these tools and techniques you should have all the information required to track down most memory leaks as well as identify speed bottlenecks in a Python program.
As with many other topics, running a performance analysis means balancing the tradeoffs between effort and precision. When in doubt, implement the simplest solution that will suit your current needs.
Refrences
文章参考:http://www.huyng.com/posts/python-performance-analysis/


